| The Break-Even Formula | ||
| Overview | ||
|
The "break-even" point is the point at which total revenues equal total costs. At this point, companies begin to earn a profit. Companies tend to look at the break-even point in terms of sales volume. For example, "Company A will break even after selling 500 widgets." Companies also look at the break-even point in terms of time. For example, "Company B will break even after 2 years." No matter how companies refer to the break-even point, they always begin with the Break-Even formula. |
||
| The Break-Even Formula | ||
|
Below is the standard derivation of the Break-Even formula: On the left side of the equation, the total revenues are calculated by multiplying the Price per unit by the Volume. The Volume is the number of units that will be sold. On the right side of the equation, the total costs are calculated by first multiplying the Variable Costs per unit by the Volume. This product is then added to the Fixed Costs to determine the Total Costs. When both sides of the equation are equal, the break-even point has been found. This formula can be re-arranged as follows: Looking at the formula this way makes it clear that the purpose of the Break-Even formula is to determine the number of units that must be sold in order to recover all of the fixed costs. The denominator of the right side of the equation, Price - Variable Costs, is often referred to as the contribution margin. The contribution margin is the amount each unit sold "contributes" to the recovery of the fixed costs. For example, if the price of a widget is $10 and the variable cost is $6, the sale of one unit will recover $4 of fixed costs. Once all of the fixed costs have been recovered, the venture will begin to earn a profit. The break even (BE) period can be calculated using the equation below: The Break-Even Period can be any measure of time, including weeks, months, quarters, or years. It is calculated by dividing the Break-Even Volume by the Sales volume anticipated per period.
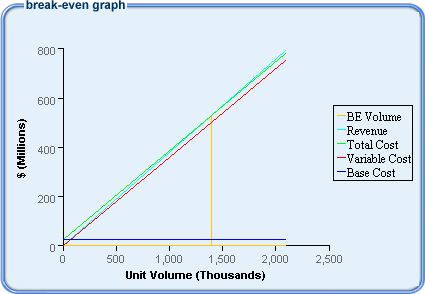
This figure below is the graphical representation of the Break-Even formula. |

|